The data is from the Buenos Aires General Directorate of Statistics and Census and is the first official from last month.
During July, the variation of the IPCBA responded fundamentally to the rises in the following divisions: Food and non-alcoholic beverages, Restaurants and hotels, Housing, water, electricity, gas and other fuels, Recreation and culture and Clothing and footwear, which together explained 66.9% of the increase in the General Level.
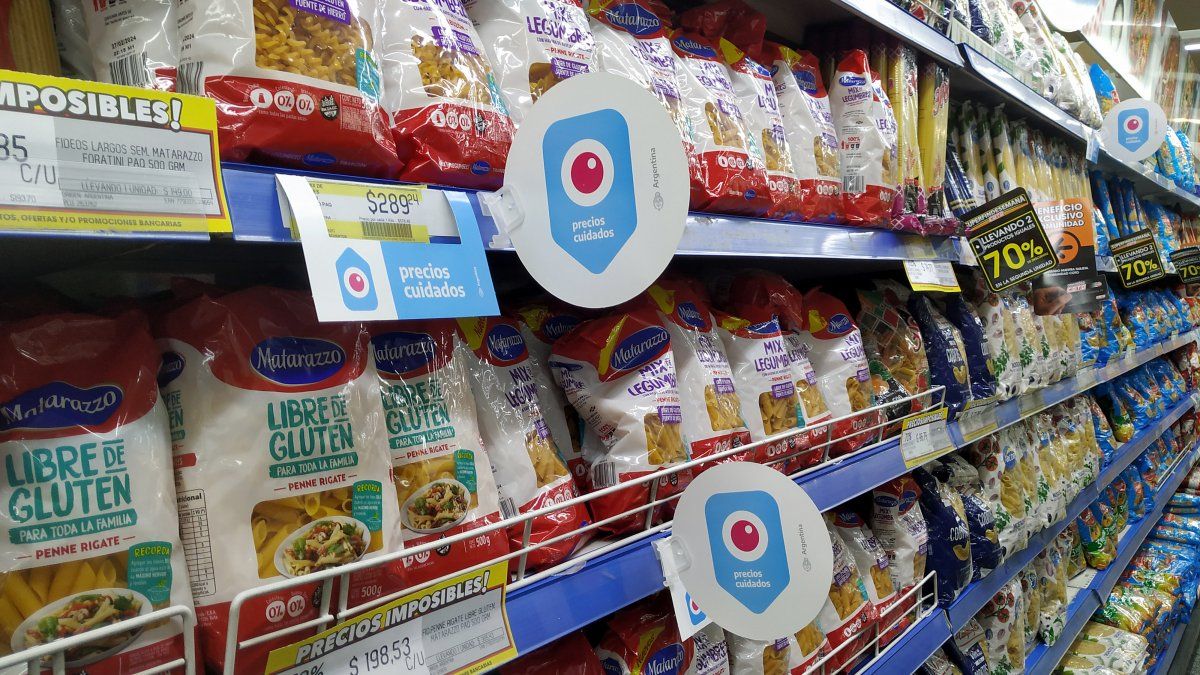
Food and non-alcoholic beverages averaged a rise of 7.7%, contributing 1.36 percentage points to the monthly variation of the IPCBA. Within the division, the main impulses came from Bread and cereals (7.4%), Milk, dairy products and eggs (8.3%), Meat and derivatives (4.5%) and Vegetables, tubers and legumes ( 11.3%), highlighted the City’s statistics body.
Likewise, Restaurants and hotels increased 12.3%, with an impact of 1.29 pp, as a result of increases in the prices of food prepared in restaurants, bars and eating houses, together with increases in service rates accommodation in hotels for tourist reasons.
Meanwhile, Housing, water, electricity, gas and other fuels averaged an increase of 7.1%, with an impact of 1.20 pp on the General Level, due to the impact of increases in rental values and common expenses of the house. While Recreation and culture rose 13.3% and had a 0.74 pp impact, mainly due to increases in the prices of tourist packages for seasonal reasons.
It was followed in importance by increases in the values of recreational and sports services. Clothing and footwear increased 9.4%, with an impact of 0.54 pp, with the increases in clothing prices standing out.
The rest of the divisions had a positive impact, although less, at the General Level.
Goods and services
During the month of July, Goods registered a rise of 8.2%, above Services, which increased 7.3%. The monthly dynamics of Goods responded fundamentally to increases in food prices (mainly baked goods, dairy products, meat and vegetables). To a lesser extent, the increases in the values of clothing, personal care items, medicines, footwear and automobiles stood out.
While, the behavior of Services mainly reflected the increases in the prices of restaurants, bars and eating houses, in hotel accommodation rates, in rental values and in common housing expenses. It was followed in importance by the increases in the prices of tourist packages and the adjustments in prepaid medicine and formal education fees. Thus, in the first seven months of the year, Goods accumulated an increase of 46.8% and Services of 41.7%. In year-on-year terms, both groups accelerated to: 71.7% yoy in the case of Goods (+7.9 pp compared to the previous month) and 67.1% yoy in the case of Services (+7.2 pp )
Breaking it down by sub-indices, during the month of July the group Rest IPCBA of core inflation averaged an increase of 7.4%. In year-on-year terms, it accelerated to 71.6% yoy (+6.9 pp compared to the previous month). Seasonal goods and services averaged an increase of 15.1%, highlighting the increases in hotel accommodation rates, in the prices of clothing, in the values of tourist packages and, to a lesser extent, of vegetables. . In year-on-year terms, this group increased to 85.0% yoy (+14.9 pp).
Finally, the Regulated group increased 4.3%, mainly due to increases in prepaid medicine and formal education fees. It was followed in importance by the adjustment in the residential rate of the water supply service. Thus, this aggregate increased its growth rate to 45.7% yoy (+5.4 pp).
Source: Ambito
David William is a talented author who has made a name for himself in the world of writing. He is a professional author who writes on a wide range of topics, from general interest to opinion news. David is currently working as a writer at 24 hours worlds where he brings his unique perspective and in-depth research to his articles, making them both informative and engaging.


