On average, the participation of the producer explained 28.2% of the final sale prices. Strawberry producers had the highest participation (51.6%), while red apple producers had the lowest (9.9%).
The gap in fruit and vegetable products and in farmers
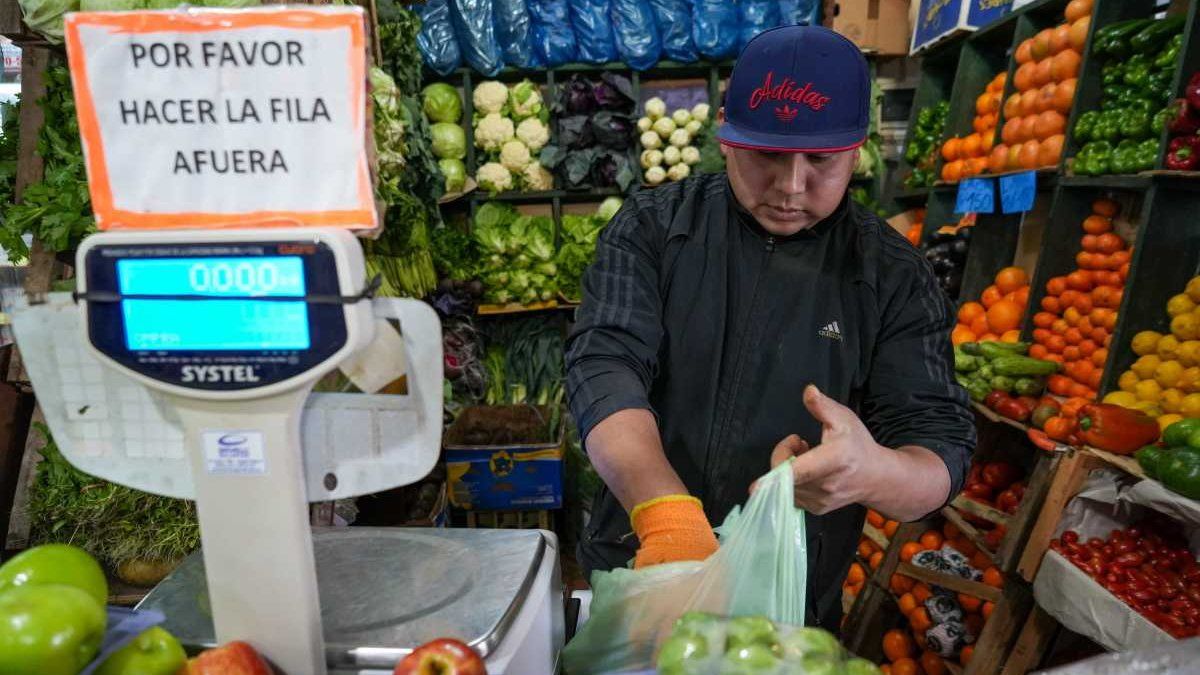
fruit and vegetable IPOD: from the field to the shelf, the prices of the 19 fruits and vegetables that make up the IPOD basket multiplied by 4.9 times in January, for which the consumer paid $4.9 for every $1 that the fruit and vegetable producer received.
livestock IPOD: for the five livestock products and by-products that make up the IPOD basket, the consumer paid three times more than what the producer received.
ipod came food report january 2023.jpg
Major and minor IPOD gaps for January
Products with the largest monthly IPOD gaps
The red apple (10.1 times), carrot (10), zucchini (9.1), pear (7) and tangerine (6.4 times), They were the five products that presented the greatest difference between the prices of origin and destination.
The red apple was the food with the greatest gap between the producer and the consumer. posted a monthly increase of 23% on the prices of origin and 40% on gondola. Pear prices, for their part, increased 23.1% at origin and 9% at destination. It is worth mentioning that both seasonal products have undergone a rearrangement in producer prices.
Another of the fruits that presented a great difference in prices from the field to the gondola, in this case due to lack of supply, was the mandarin –product out of season– with a monthly increase of 29.3% at origin and 14% at destination .
In relation to vegetables, carrots registered an increase of 21% in producer prices and 18% to consumers, while the price of zucchini fell 10% at origin and 12% at the shelf.
Products with lower monthly IPOD gaps
Among the products that presented the smallest difference between the price received by the producer and the one paid by the consumer are two products of animal origin and three fruit and vegetable products.
In the case of the strawberry (1.9 times), product with the lowest gap of the month, prices increased by 42.4% to the producer and 12.5% to the consumer. Since it is a fruit that everyone needs to have on the shelf, the greengrocer and/or the hypermarket resigns profitability, thus narrowing the difference between the price received by the producer and the one paid by the consumer.
The prices of the chard and cabbage (2.5 times)For their part, they recorded an increase at source of 52% and 96%, respectively –due to high temperatures that burned green leafy vegetables–. Meanwhile, at destination they increased 21% in the first case and 8% in the second.
Regarding the low farm-shelf gap of livestock products and by-products, eggs and chicken (2.2 times), they generally have integrated production systems, which means that all the actors in their respective value chains are part of the business risk.
What is expected for what comes
The fall in the purchasing power of consumers has also limited maintaining and/or raising the shelf prices of several of the products that make up the IPOD basket.
Likewise, another of the factors that influenced the setting of prices of agricultural products was the increase in logistics costs: during 2022, basic inputs such as diesel and tires presented increases of 121% and 124%, respectively, increases that exceeded to inflation.
Source: Ambito


