In November the prices of agri-food They multiplied by 3.6 times from the field (origin) to the gondola (destination). That is, the consumer paid $3.6 for every $1 the producer received.
On average, producer participation explained 23.7% of final sales prices, 6.7% less compared to the previous month. The greatest participation was had by the producers of chicken (55.1%), while the lowest was for those of orange (12.9%). The data is provided by the Price Indicator at Origin and Destination (IPOD) prepared by the Regional Economies sector of the Argentine Confederation of Medium Enterprises (CAME).
During November 2024, The regional economies have not had major agroclimatic problems, except for some green belts (Santa Fe, for example). A dissimilar behavior was seen between the fruit basket, which increased its price on the shelf, and the vegetable basket, which trended downward – 10% decreased according to the National Institute of Statistics and Censuses (INDEC)–.
The consumer continues without validating prices, observing the low participation of the producer (23.7%) as the first link in the value chain resigns profitability.
675c583707078_706x432.png
The consumer continues without validating prices, observed in the low participation of the producer (23.7%) in its profitability
The gap in fruit and vegetable products and those of animal origin
- Fruit and vegetable IPOD: From the field to the shelf, the prices of the 19 fruits and vegetables that make up the IPOD basket multiplied by 5.8 times in November, which represents an increase of 13.7% compared to October.
- IPOD of animal origin: For the five products and by-products of animal origin that make up the IPOD basket, the consumer paid 2.9 times more than what the producer received. The livestock IPOD has not shown any changes for six months.
Biggest and smallest IPOD gaps for November
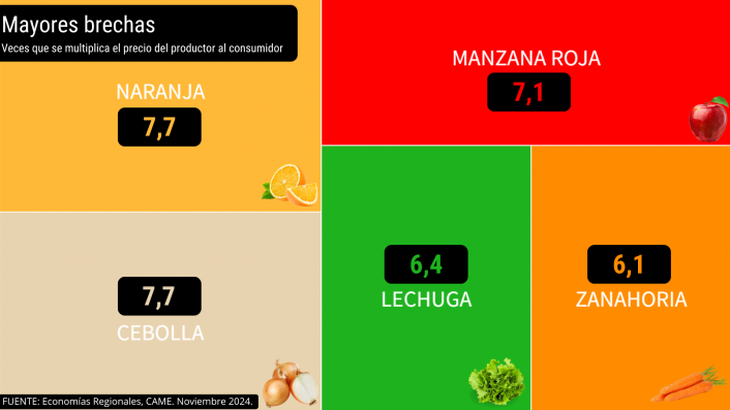
Products with the largest monthly IPOD gaps
The orange (7.7 times), the onion (7.7 times), the red apple (7.1 times), the lettuce (6.4 times) and the carrot (6.1 times), were the five products that presented the greatest difference between origin and destination prices.
The orange It decreased 29.9% at origin and increased 3.8% at destination. For fresh fruit, prices continue to be low, lower than the cost of production; while producers receive double the payment for what goes to industry – although quota restrictions limit processing.
For their part, the prices of onion Both the producer (19.9%) and the consumer (21.5%) fell due to an increase in supply, since the market has been replenished as a result of an improvement in production.
The apple and the lettuce They presented the same behavior, since their prices rose at both ends of the chain. In the case of pome fruit, it showed an increase of 8.4% at origin, due to greater commercialization, and 4.7% at the shelf; while green leafy vegetables rose 9.3% for the producer and 4.4% for the consumer, due to the intense rains that damaged the harvest in the province of Santa Fe.
Lastly, the carrot It decreased 49.2% at origin, due to improvement in production and expansion of supply, and increased 2% at shelf.
675c583719867_706x397.png

Orange was the product that presented the greatest difference between origin and destination prices.
Products with lower monthly IPOD gaps
Of the five products that presented the smallest difference between the price received by the producer and that paid by the consumer, three are part of the basket of animal origin and two of the fruit and vegetable basket.
With 1.8 times, the chicken was the product with the smallest gap of the month, increasing its producer prices (6.2%), but decreasing them on the shelf (2.1%). The eggs (2 times), for their part, they lowered their prices at both ends of the chain: 0.4% at origin and 9.5% at destination.
In relation to fruit and vegetable products, the strawberry (2.7 times) and the pumpkin (3.1 times) increased for both the producer and the consumer. The first increased 33.5% at origin, because the season is ending, and 23.8% at destination. On the other hand, the prices of the second increased by 12.8% to the producer – due to greater demand in the market – and by 31.5% on the shelf.
Lastly, the milk. At 3.3 times, its price at destination decreased (0.9%) and rose 3.2% at origin due to a better offer, caused by the decrease in dairy cows and the increase in exports.
Source: Ambito
I am an author and journalist who has worked in the entertainment industry for over a decade. I currently work as a news editor at a major news website, and my focus is on covering the latest trends in entertainment. I also write occasional pieces for other outlets, and have authored two books about the entertainment industry.


