
Rising corona incidences are causing concern with a view to winter. However, the situation is very different in the country. See what the situation is like on your doorstep.
This article is continuously updated, you can see the current status of the data in the graphics.
Introduction: north-south divide
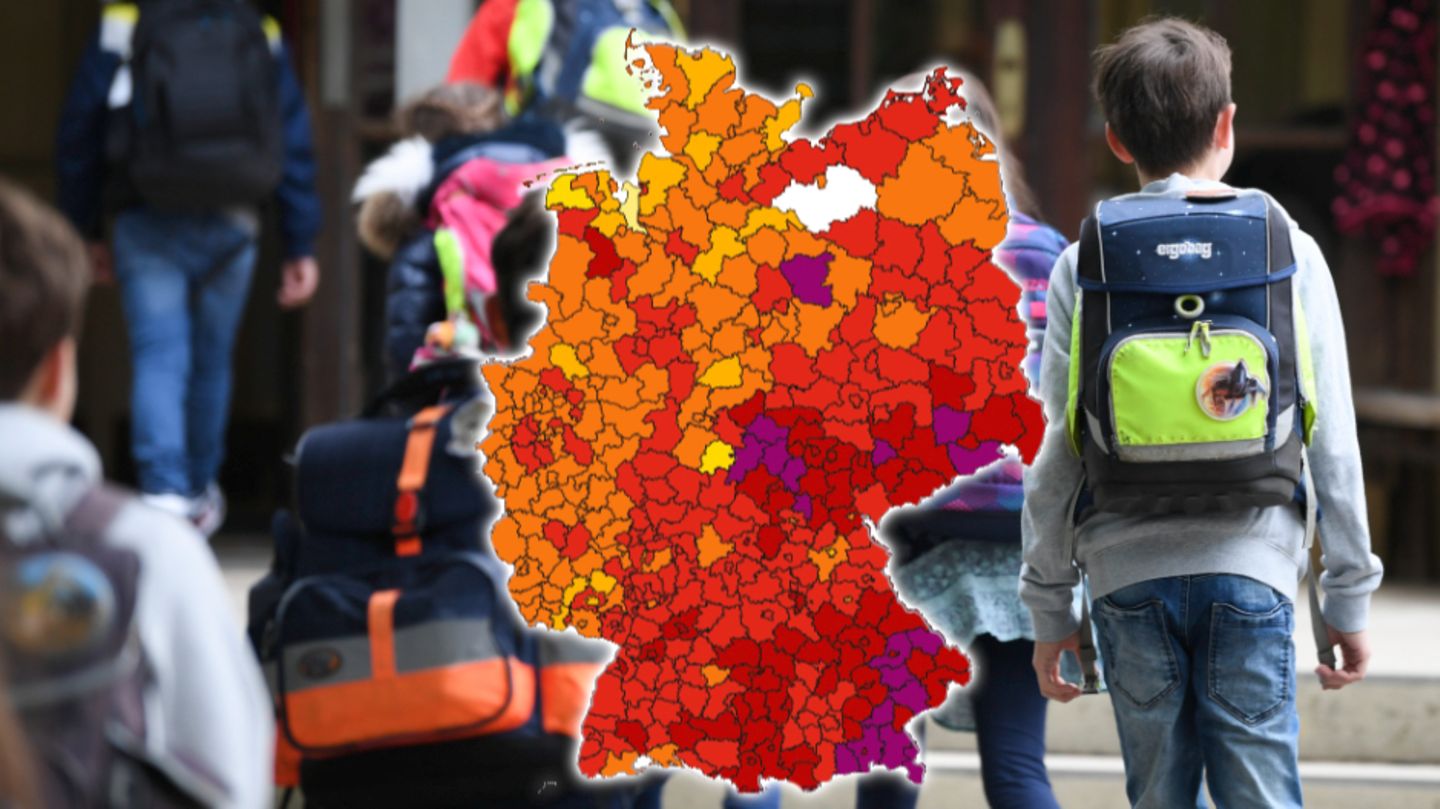
The corona numbers in Germany are rising again. The nationwide incidence was 130 on Thursday. However, the numbers are not increasing equally everywhere. A look at the data reveals a clear north-south divide.
Read the analysis at stern +: There is no longer any doubt: the pandemic of the unvaccinated is here! Areas with a low vaccination rate are particularly affected.
The district with the highest rate is – as of Thursday – Mühldorf am Inn in Bavaria with an incidence of 622. Emden in Lower Saxony is at the bottom of the list with 20.1. Ludwigslust-Parchim in Mecklenburg-Western Pomerania has recently reported no new cases, but whether there actually were none is questionable. According to information on the district, the Mecklenburgers are struggling with the consequences of an IT attack. In addition, the county appears to have changed its reporting mode.
You can see what your situation looks like in the graphics below. The data come from the Robert Koch Institute (RKI) and from the Risklayer project at the Karlsruhe Institute of Technology, which supplements RKI data with its own calculations and other sources. As a rule, the values are higher than those of the RKI. So far, however, the RKI data counts for taking measures.
Map I: Infection rate in German districts and cities according to RKI (official)
Map II: Infection rate in German districts and cities according to Risklayer
Ranking: counties and cities with the highest rate
The view below shows the districts and cities with the most confirmed corona cases per 100,000 inhabitants in the last seven days in descending order.
You can scroll down the view and click on the bars for more details:

Background and sources
Last year the federal and state governments set up a kind of pandemic warning system, the seven-day incidence. The idea: If the number of new infections in a district increases too much within seven days per 100,000 inhabitants, stricter protective measures will be put into effect again or relaxations will be withdrawn.
The RKI publishes the number of cases that were transmitted to it by the health authorities up to the respective day at midnight. The presentation of the newly transmitted cases per day is based on the reporting date. That is the date “on which the local health department became aware of the case and recorded it electronically,” says the RKI website. Regional officials may communicate directly with the health authorities and may have the numbers available to the RKI.
The Risklayer project supplements the RKI data with its own data and calculations.
, ,


