
What is the incidence, what is the R value? How many infected are there? Where does the virus spread faster again? At this point you will find an overview of the most important data on the subject of Covid-19.
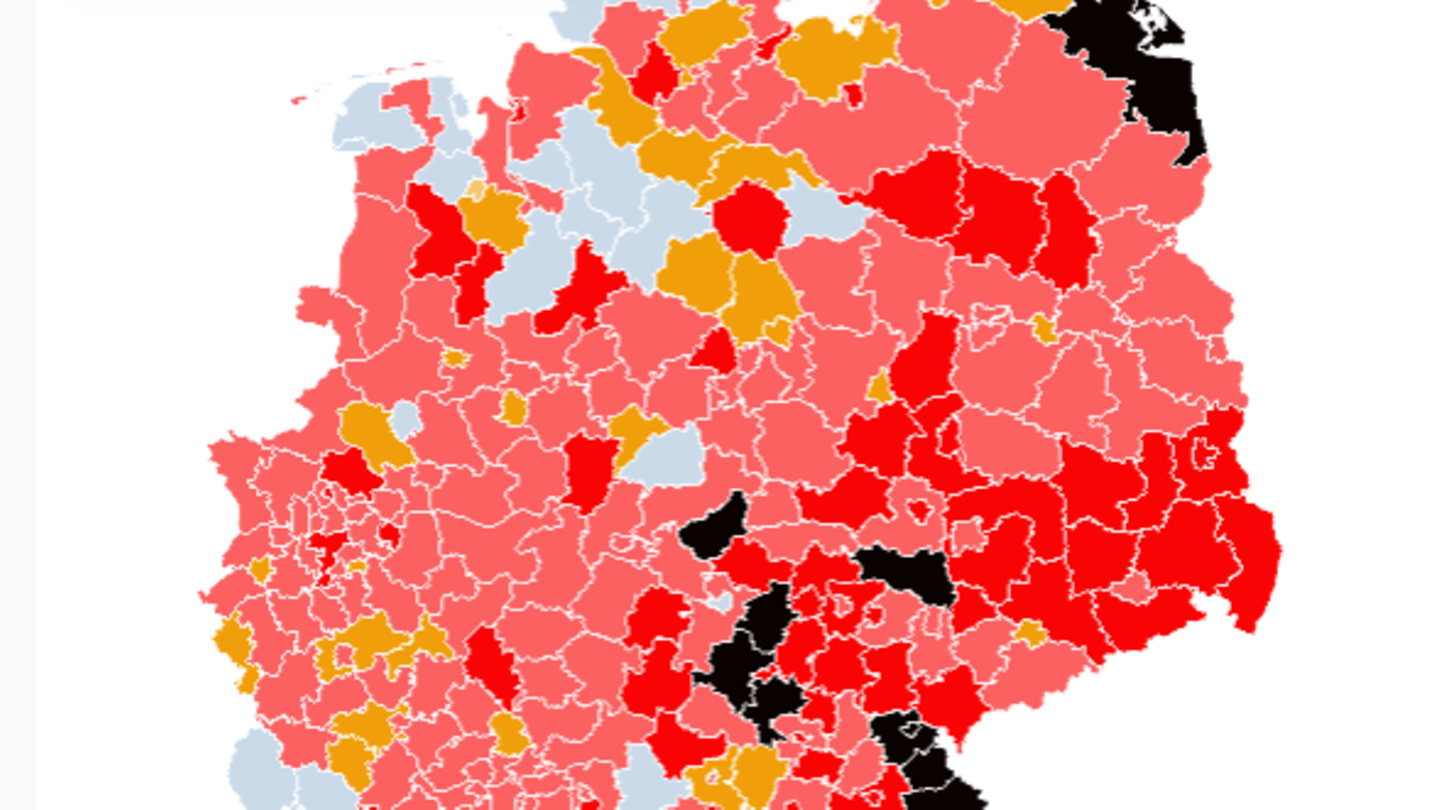
Incidence: Which counties and cities are most affected?
The Chancellor and the country leaders have installed a kind of emergency brake, the seven-day incidence. The idea: if the number of new infections in a district rises to 100 or more within seven days per 100,000 inhabitants, stricter protective measures will be put into effect again.
Note for mobile users:.
Reproduction number R – how many people does an infected person infect?
The reproduction number R, also often referred to as the R value, is one of the key indicators for assessing the course of a wave of infection. R indicates how many people an infected person infects on average in a certain period of time. The lower R, the better:
If R is less than 1, On average, an infected person infects less than another person – and the epidemic is coming to an end.
If R is 1, the number of new infections is constant and linear. So the curve no longer rises exponentially.
If R is above 1, one infected person infects more than another person on average – the number of new infections every day increases.
Note: The R-value is an estimate. According to the Robert Koch Institute (RKI), it is based on the assumed number of new Covid-19 cases. The R-value is shown with a four-day moving average. Each value is averaged with the values of the three preceding days. The estimated values for the number of new cases and the R-estimate for earlier days may deviate from the information in previous management reports because the overall course is re-estimated every day based on the currently available data. In addition, the RKI gives an average value for seven days. .
Development of the daily newly recorded coronavirus cases in Germany
Utilization of intensive care beds
Infected, recovered and deceased in Germany
You can find detailed information on the infection rate in German districts and cities here.
That’s how fast the coronavirus is spreading worldwide
The world map provides an overview of the global infection situation. See in which countries the spread is slowing down and where it is accelerating
The data in the graphics come from the Robert Koch Institute (RKI) or the American Johns Hopkins University (JHU). Both well-known bodies, but they use different methods for collecting and communicating the data. As a rule, the RKI publishes new data based on official information once a day. The JHU, on the other hand, also uses non-official sources and publishes the recorded data in real time. As a result, the RKI numbers are usually slightly lower than those of the JHU.
The data on the occupancy rate of the intensive care beds come from the DIVI intensive care register.


