
The distributors in the city of Buenos Aires and Greater Buenos Aires (Edesur and Edenor) had a greater increase than the national level, of 4.5% together. By segment, residential and industrial consumption rose, while commercial consumption fell due to the recession.
One of the data that explains the increase in electricity consumption was the low temperatures. “Looking at the temperatures, the month of August 2024 was colder compared to July 2023. The average temperature was 12.7 °C, while in the same month of the previous year it was 12.6 °C, and the historical is 14.2 °C”the report stressed.
Demand in homes, businesses and industries
As for the residential demand In August it reached 49% of the total country, with an increase of 8.1% compared to the same month of the previous year.
Meanwhile, the commercial demand It decreased 0.9% and accounted for 26% of total consumption.
The industrial demand It reflected 25% of the total, with a slight increase in the month of approximately 0.01%.
How much energy was consumed in August 2024?
In August 2024, the total net demand for Wholesale Electricity Market (MEM) was 12,171.4 GWh. The previous year it had been 11,756.02 GWh, which reveals an increase of 3.5% in the interannual comparison.
But at the same time, in August there was a drop of -8% compared to the previous July, which reached 13,226.3 GWh, the third most important consumption in history. The reason? July was one of the coldest months in recent years.
The monthly analysis further reported that on August 22, 2024 at 8:50 p.m. a maximum power of 23,806 MW was recorded, but it remained far from the historical record of 29,653 MW, recorded in February 2024.
Days ago, the national government launched a contingency plan for possible power outages in summer, which they estimate could exceed 30,100 MW of demand.
Evolution of consumption in recent months
In the last 12 months the electrical demand It recorded six months of decline and six months of rise, not in a row. The rolling year (last twelve months) had a drop of 0.4%.
Regarding consumption by province, in August there were 19 districts (provinces and/or companies) with higher electricity consumption.
Chubut (36%), San Juan (11%), La Rioja (11%), Córdoba (7%), Salta (6%), Tucumán (6%), Santiago del Estero (5%), Catamarca (3% ), EDELAP (3%), Mendoza (3%), Santa Fe (3%), EDEN (3%), Entre Ríos (2%), San Luis (2%), Jujuy (1%), Corrientes (1 %), Río Negro (1%), inter alia.
For their part, eight provinces presented decreases in consumption: Misiones (-13%), Formosa (-9%), Chaco (-3%), La Pampa (-3%), EDEA (-3%), EDES (-2%), Santa Cruz (-2%) and Neuquén (-1%).
In reference to the detail by region and always in an interannual comparison, the variations were the following:
- NEA –Chaco, Formosa, Corrientes and Misiones- presented a decrease: -4.4%.
- COMAHUE –La Pampa, Río Negro and Neuquén- decreased -0.2% compared to August 2023.
- BAS – the entire interior of the province of Buenos Aires (including La Plata and not counting Capital Federal and GBA) – marked 0.8%.
- COAST -Between Ríos and Santa Fe– consumption grew: 3.1%.
- METROPOLITAN -City of Buenos Aires and GBA – had an increase in consumption: 4.5%.
- CUYO -San Juan and Mendoza- consumption increased by 5%.
- NOA –Tucumán, Salta, Jujuy, La Rioja, Catamarca and Santiago del Estero- increased demand by 5.6%.
- CENTER -Córdoba and San Luis- the growth in demand was 6%.
- PATAGONIA –Chubut and Santa Cruz- consumption rose 27.9% compared to the previous year.
Regarding the detail of the Capital and GBA distributors, which demanded 35% of the country’s consumption and totaled a joint increase of 4.5%, CAMMESA records indicate that Edenor had an increase of 3.5%, while in Edesur demand rose 5.8%.
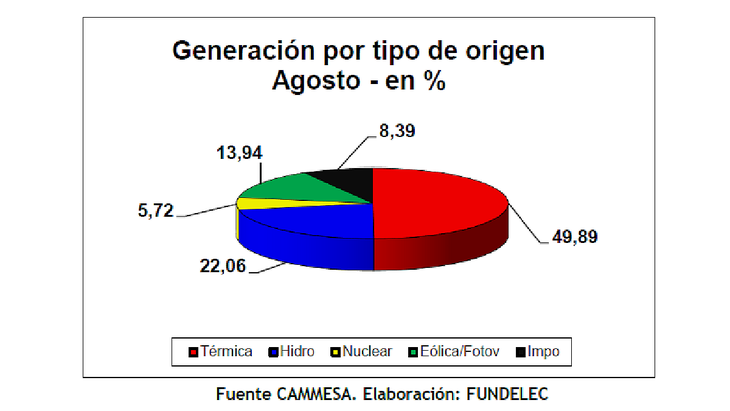
How was power generation in August?
The thermal and hydraulic generation They are the main sources used to satisfy demand, although the growth of renewable energies stands out.
In August, hydraulic generation was ranked in the order of 2,792 GWhwhich represents a negative variation of -32.6%.
image.png
For its part, The installed power is 43,951 MW, where 59% corresponds to thermal source and 37% of origin renewable.
Likewise, thermal dispatch was higher, at the same time that fuel consumption also ended up being higher if compared month to month at the total level.
Thus, this month it continued to largely lead thermal generation with a production contribution of 49.89% of requirements.
On the other hand, the hydroelectric plants contributed 22.06% of the demand, the nuclear provided 5.72% and the electricity generators alternative sources 13.94% of the total. On the other hand, the import represented 8.39% of the demand.
Source: Ambito


