

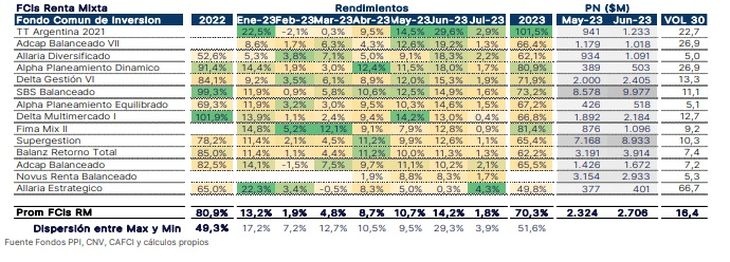
“Let’s remember that, although these funds, given the composition of their portfolio, tend to have higher volatility, during June it decreased considerably if we compare it with the rest of the months. In this way, during the sixth month of the year, they reported average values close to 28 percentage points,” indicated PPI.
FCI of mixed income also got on the podium
these funds mix Fixed Income financial instruments (Sovereign Securities, Negotiable Obligations, etc) and Variable Income (Shares and/or Cedears). “This type of portfolio holdings naturally generate higher volatility than the rest of the fund categories, such that in June they averaged increases of up to 6.4 pp,” explained PPI.
The increases in June averaged 14.2%, the highest so far this year. According to the same report “they were driven by the good performance of the shares they hold in their portfolio, stretching the accumulated of the last six months up to 70% average.” The FCI that advanced the most was TT Argentina 2021 (Banco Hipotecario) with 29.6%.
FCI mixed june.jpg
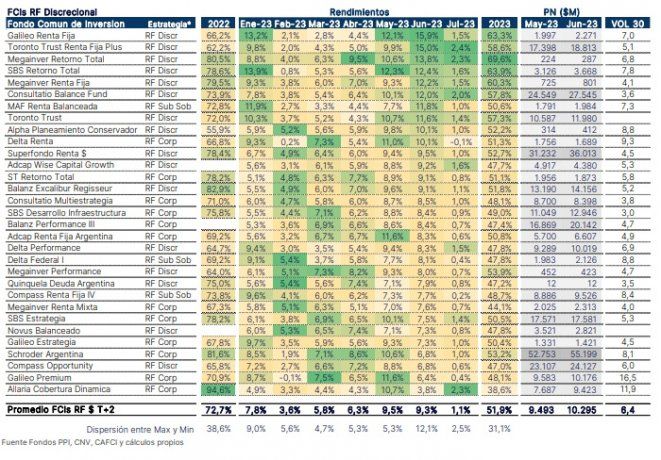
FCI Discretionary: had its best month in 2023
These funds – which include different risks and strategies – managed to add an average of 9.5% in June, and in June they had their best performance of the whole year. Its volatility, meanwhile, averaged 6.4 pp
These options -in line with the CER strategies-, achieved the highest returns so far in these 6 months, and thus rose 51.9% in the year. “Discretionary strategies (which maintain a mix between different currencies, adjustments and risks) had the highest gains with 55.4% on average,” said PPI.
The portfolios reported associated IRRs close to 121.5% on averagewith durations that oscillate between 0.8 years for sub-sovereign strategies -with IRRs of 122%- and 1 year, for Discretionary or Balanced strategies -today 116%-, indicated the same report.
FCI discretionary june.jpg
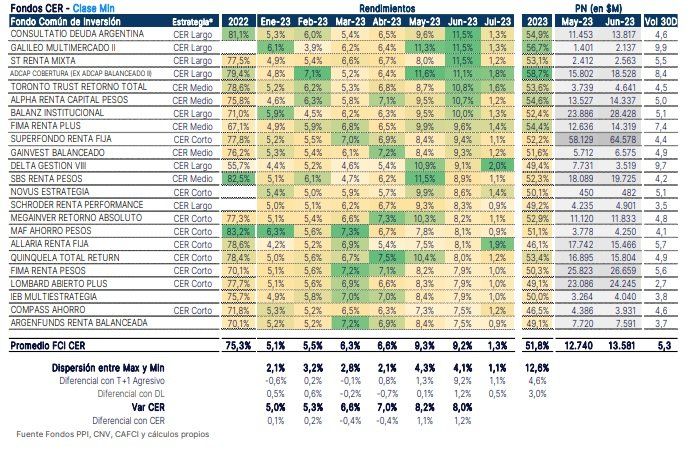
The FCI tied to the CER: they beat inflation
The CER funds had returns of 9.2% on average. This allowed them to outperform the CER index by 1.3p.p. If we look at the accumulated yields in these months, they already add up to gains of 51.8%. In the breakdown, the longest strategies (durations greater than one year), achieved average returns of 10.4% in June -and cumulative returns of 54%- with volatilities of 6.7 pp
It should be noted that the latest inflation data was 7.8% (on May), and slowed down from the previous 8.4%, but in the accumulated the increase is already close to 115% (year-on-year). “Meanwhile, the focus – and a key point to analyze during the first weeks of the current month – will be on the inflation data for June, which is expected to be below 8% again,” they said from PPI.
The fund that paid the most was Consultatio Deuda Argentina with 11.5%. In the breakdown, the longest strategies (durations greater than one year), achieved average returns of 10.4% in June –and cumulative of 54%– with volatilities of 6.7 pp
FCI CER June
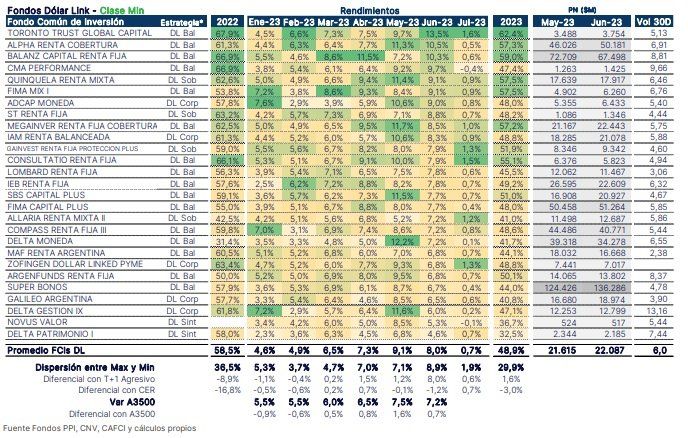
FCI dollar linked: rose an average of 8.5%
The funds achieved returns and marked an average performance of 8.5%. These FCIs that follow the evolution of the official dollar have accumulated yields of almost 50% (on average). Profitability rose above its Benchmark, which is the BCRA A “3500”, which had an increase of 7.2% against May.
“If we compare the evolution of the index, we notice that there was a deceleration in the rate of devaluation by the BCRA -where the crawling peg reached 60% of TNA (daily rate) at the end of the month-. Its IRR average levels close to devaluation – 8.3%. Meanwhile, the durations are around 0.8 years,” indicated PPI.
FCI dollar linked june.jpg
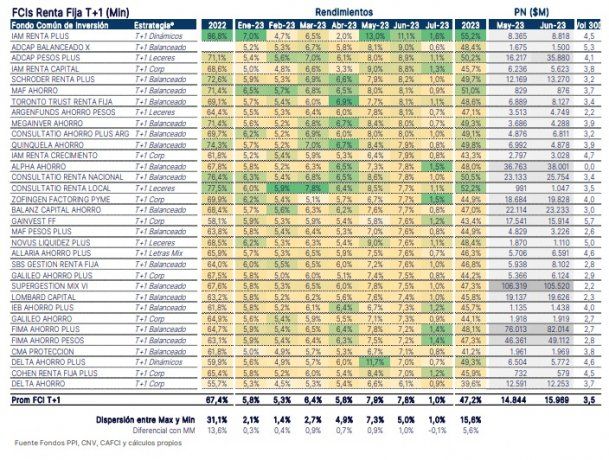
FCI fixed income: dynamic options recorded higher increases
The FCI averaged 7.8%, although within this universe, dynamic options were the highest earners within the segment. These funds averaged increases of 12.4% -although at the cost of stretching the duration above 300 days-. Even, in the year they already manage to show yields above 50% vs. 47.2% showing the category in general.
“The composition of the T+1 began to change during June and, particularly, it can be observed in the duration of the portfolio of this type of funds -today exceeding 0.3 years (vs the 0.2 that averaged in the first months of the year) – This is due, in part, to the incorporation of sovereign securities with maturities after STEP 2023 in the portfolios of said funds,” said PPI.
Meanwhile, for this category the indicative IRRs are around 128% and show an associated volatility of 3.5 pp The Dynamic options -by incorporating a variety of instruments such as synthetics, duals or Hard Dollar- are at a 146% expected annual return.
FCI fixed income June.jpg
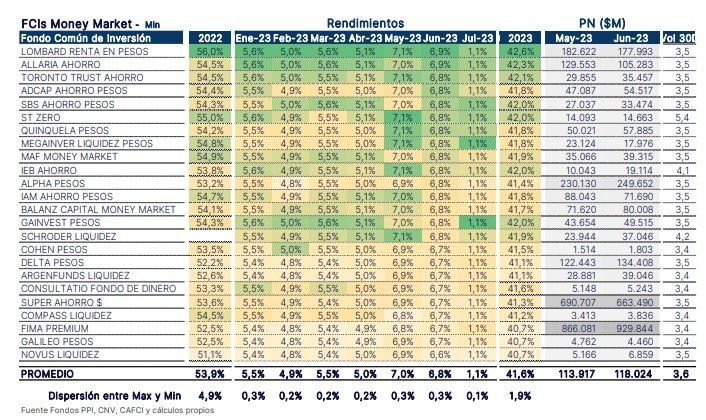
Bottom of the table: money market
According to PPI, “the preference for immediate liquidity took a pause in June.” These funds were the hardest hit category, reporting the largest outflows in the FCIs Industry. “However, this did not affect the yields. Thus, they managed to harvest 6.8% on average during June, remaining only 1 percentage point below the T+1,” the same report indicated.
Meanwhile, so far this year, they have already accumulated average yields above 41%. Its indicative TNAs today are around 83%, below the Badlar Rate and TM20, which stand at 92.5% and 89.9%, respectively.
FCI money market June.jpg
Source: Ambito
I am a 24-year-old writer and journalist who has been working in the news industry for the past two years. I write primarily about market news, so if you’re looking for insights into what’s going on in the stock market or economic indicators, you’ve come to the right place. I also dabble in writing articles on lifestyle trends and pop culture news.


