The world investor week (Word Investor Week) is a global campaign carried out by the International Organization of Securities Markets (IOSCO-IOSCO) that aims to raise awareness about the importance of financial education and investor protectionas well as highlight the initiatives of regulators to expand knowledge about the financial instruments.
Recently, a report prepared by the Buenos Aires Stock Exchange through “BCBA Joven” –which could be accessed Scope. revealed the trends, the degree of knowledge and use of different financial instruments and the different entities that are part of what we call “capital markets.”
The study is based on a qualitative survey that was carried out at the end of August in collaboration with “Opina Argentina” and has a sample of more than 1,000 cases, among inhabitants from 18 years old to more than 50 years old. What key data about the financial market does this analysis reflect?
Trends in financial products
Some of the most important points to highlight are the following:
- The credit card is the most used financial product (53%). The age segment 30-49 years old is the one that uses the product the most (62%). In terms of investments, the six financial assets that they have or have used are: the purchase of dollars (21%); time deposits (19%); investments in mutual funds (17%); purchase of cryptocurrencies (14%); investments in stocks (13%); and investments in bonds (8%).
- Between 10 and 15% of those surveyed say they have or having made investments in cryptocurrencies, bonds and public securities and stocks.
- The Young people report significantly higher cryptocurrency use (36%) than the 30-49 year old segment (7%) and those +50 years (1%).
- The Virtual wallets (32%) are the most used means of payment along with cash (33%). The new digital payment method relegated traditional means such as debit cards (21%) and credit (7%).
- In turn, 6 out of 10 respondents say they have or pay with QR or virtual wallets.
- The men, the young and the most educated They tend to be the social groups that make the most use of financial products.
- Due to the uncertainty produced by the high inflation regime, All social segments show a proclivity for the use of financial instruments.
useinstrumentos.png
Income and payments: the weight of cash is maintained
According to the survey, a 60% of those surveyed affirm that they receive their income through bank deposits, 26% in cash (reflecting the strong informal economy that exists in Argentina) and 10% over the counter through the bank.
To perform payments and transactions, the majority of respondents (33%) claims to use cash, 32% virtual wallets, 21% debit cards and 7% credit cards. Despite the strong growth of payment with QR (more than 300% year-on-year, according to data from the Central Bank), only 4% of those surveyed carry out operations through this means. However, 62% of those surveyed have and use virtual wallets, with a higher incidence in men aged 16 to 49 years.
More than half of those surveyed claim to have no savings capacity
- Almost 6 out of 10 respondents say they make a calculation of future income and expenses at home. Women (65%), the 30-49 year old segment (69%) and people with a higher educational level (67%) are the most forward-looking groups.
- He 58% say they do not have the ability to save. The purchase of foreign currency (12%) is the most chosen means among those who do have savings capacity.
- 7 out of 10 respondents faced more expenses in the last year than they could cover with their usual income. In this universe, the use of savings (18%) was the most chosen response as a means to meet these expenses.
When asked about their ability to save and what they do with their money, the majority of respondents stated the following:
1. 63% did not save in the last time
2. 12% saved dollars
3. 9% Bought financial investment products, such as time deposits, bonds and/or stocks.
4. 7% Deposited money in a savings account.
69% spent more this year than they could afford
According to the same study, 69% of those surveyed stated that they spent more than they could cover with their income, while 30% said no.
Of those who answered affirmatively, 18% used their savings to cover that deficit, 14% generated new income, paid their bills later or requested credit.
Trust in banks and financial products
Other data from the extensive study reflects the following information:
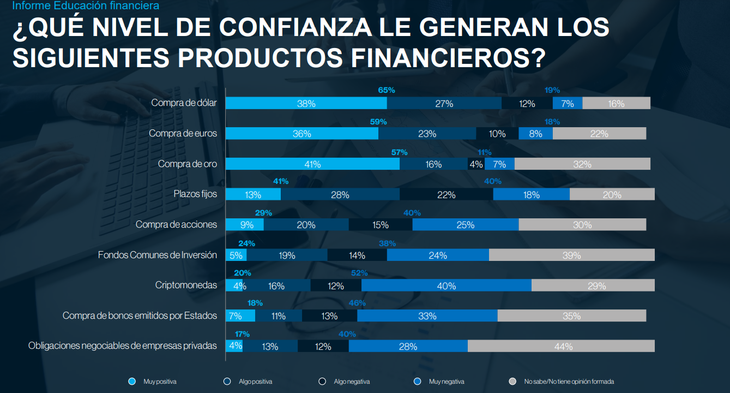
- The products that produce the most confidence are purchase of traditional currencies/goods such as the dollar, euro and gold (between 57 and 65% security is reported)
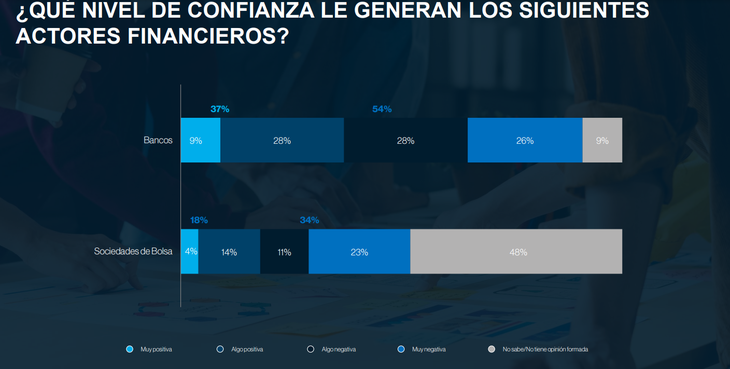
- The Banks, for their part, are the financial actor that produces the most distrust among those surveyed (54%). Although 37% of the general sample claims to have confidence in banks, among under-29 year olds this feeling falls to 27%.
- Regarding stock exchange companies or Alycs, Strikingly, 48% say they do not know about the subject, while 23% say they are “very negative.”
- 1 in 2 people say they are distrustful of cryptocurrencies. Confidence among the total number of respondents is 20%, but among under-29 year olds it rises to 40%.
- In turn, the Fixed deadlines especially produce confidence in the 30-49 years segment (53%, against an average of 41% in the general sample) and the purchase of shares register a significant gender gap in terms of trust (41% of men trust this instrument, compared to 17% of women).
markets4.png

Screenshot 2024-10-08 182850.png

Source: Ambito
I am a 24-year-old writer and journalist who has been working in the news industry for the past two years. I write primarily about market news, so if you’re looking for insights into what’s going on in the stock market or economic indicators, you’ve come to the right place. I also dabble in writing articles on lifestyle trends and pop culture news.


