
What markets are demanding? Which ones offer lower valuations? What risks are there? In this note I show you the three countries with the higher valuations and lower of the world, according to the ratio Price-to-Earnings forward (NTM). That is, how much the market is paying today for every dollar of projected future gain.
It is a clear photo of what countries are “expensive” and which are “cheap” According to this key multiple. And as I always say: “Caro” or “Cheap” is relative. It depends on the type of country, the expectations, the context, among other things. But as a starting point, it is useful.
A small, defensive market, with stable companies but with low growth. This ETF has only 25 positions. There is little supply supply and a lot of demand for stability, which pushes the multiples up.
- United States (SPY) – P/E NTM: 23.4x
The S&P 500 quotes expensive, but not for anything. Inside are Nvidia, Microsoft, Amazon, leading companies with bestial margins. The market is committed to continue dominating. High valuation and high expectations.
- India (Inda) – P/E NTM: 23.3x
India has high demography, a lot of technology, growing international investment flows. But all that is already incorporated into the current price. In fact, it is not having a great year.
The 3 cheapest countries in the world
- Brazil (EWZ) – P/E NTM: 6.5x
Discount for political risk and historical volatility. But many companies are with very low valuations regarding their history. In fact it has been one of the best countries of the year.
- Türkiye (Tur) – P/E NTM: 6.7x
A country with very high inflation, unpredictable politics and weak currency. Their actions are very fragile and do not show positive signals at the moment.
- Colombia (Colo) – P/E NTM: 7.1x
Chico market, little liquid and out of the radar. But that can be an opportunity if disinterest is reversed. Obviously it also has a lot of political noise.
Why does this ratio matter? Because the higher the P/E, the more you have to trust that everything goes well. There is not so much margin for errors.
Let’s look at a graph that explains it very well:
Shows the historical relationship between the ratio Price-to-Earnings (P/E) Forward of the S&P 500 and the average annual yields to 10 years that were obtained after buying at that level of valuation.
When the S&P 500 was bought with low multiples, the returns to 10 years were very good. And when bought with high multiples (like today), future returns were low … or negative.
Today the valuation is high. That does not mean that you have to sell everything, since prices accompany. But the starting point is high and the margin for positive surprises is more limited.
How did these countries go in 2025? Let’s see:
GRAPH 2
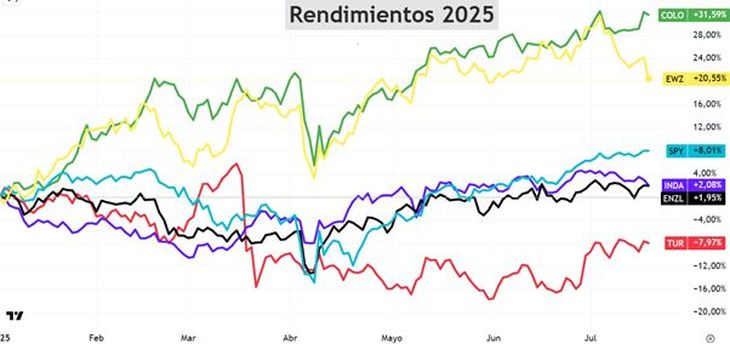
This year he left a clear message: the “cheap” markets were the ones that uploaded the most. Colombia (Colo) and Brazil (EWZ), with low multiples and little glamor for the global investor, lead the ranking with 32% and +21% rises respectively.
On the other hand, countries with demanding values such as India (Inda) and New Zealand (Enzl) barely moved, with marginal increases of 2%. USA (SPy) is firm with an 8%rise. And the worst? Türkiye (Tur), which despite its bass p/e, fell -8%. It is a reminder: the cheap can leave expensive if there are real background problems.
The key is to understand the context and not keep a single number. The P/E is useful, but it only does not reach.
If you are interested
Note: The material contained in this note should not be interpreted under any point of view as an investment council or recommendation for the purchase or sale of a particular asset. This content has only educational ends and represents only an opinion of the author. In all cases it is advisable to advise with a professional before investing.
Source: Ambito
David William is a talented author who has made a name for himself in the world of writing. He is a professional author who writes on a wide range of topics, from general interest to opinion news. David is currently working as a writer at 24 hours worlds where he brings his unique perspective and in-depth research to his articles, making them both informative and engaging.


