

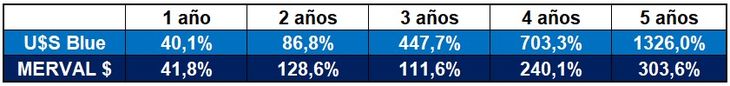
Blue dollar vs inflation
Assuming a monthly inflation of 5.3% in June, we compare its evolution against the variations of the informal dollar. The price index 12 months ago, accumulates an inflation of 64.0% while the interannual variation of the Dolar blue it was 40.1%. Compared to June 2020, that is, 2 years ago, inflation is 146.3% compared to 86.8% for blue. If we extend the horizon, 3 years back the trend changes and 4 and 5 years the same thing happens, taking advantage of the dollar informal in the face of price variations. It is to highlight what the informal dollar increased in a period of 5 years. From $16.90 that was trading in June 2017, it ended up trading $241 on the last business day of June this year, experiencing a growth of 1,326.0%.
Blue dollar vs stocks
On the other hand, we chose to compare the variation of the informal dollar with the evolution of the Merval Index, to analyze the average evolution of variable income instruments. Let us remember that the Merval Index is the market value of a portfolio of shares, selected according to participation, number of transactions and listing value on the Buenos Aires Stock Exchange. This comparison returns the same result as the previous one. The Merval Index beats the dollar information in the variation between 1 and 2 years ago, while the trend changes when we analyze between 3 and 5 years ago. Between June 2022 and June 2017, the average market value of a group of shares increased 303.6%, half the accumulated inflation in 5 years and four times less than the informal dollar increased in the same period.
download (3).jpeg
blue dollar vs construction
We also wanted to compare the price of the parallel dollar with the Index of the Chamber of Construction (CAC), which measures the variation in construction costs, discriminated between materials and labor. Again we find the same results, it is a situation between the last 2 years, while it is the reverse situation when we extend ourselves over time.
download (4).jpeg

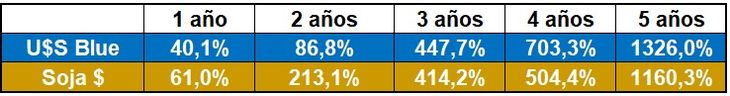
Blue dollar vs soy
Although it seems that no asset or instrument has beaten the evolution of the informal dollar in the last 5 years, of the values that we analyzed, the one that came closest was the price of soybeans. In June 2017, the slate price reported in the Rosario, Santa Fe market was $3,880 per ton of soybeans. If we compare said value with that reported on the last business day of June this year, which amounted to $48,900, we identify a variation of 1,160.3%.
download (5).jpeg
Degree in Business Administration. Consultant Salvador DiStefano
Source: Ambito


