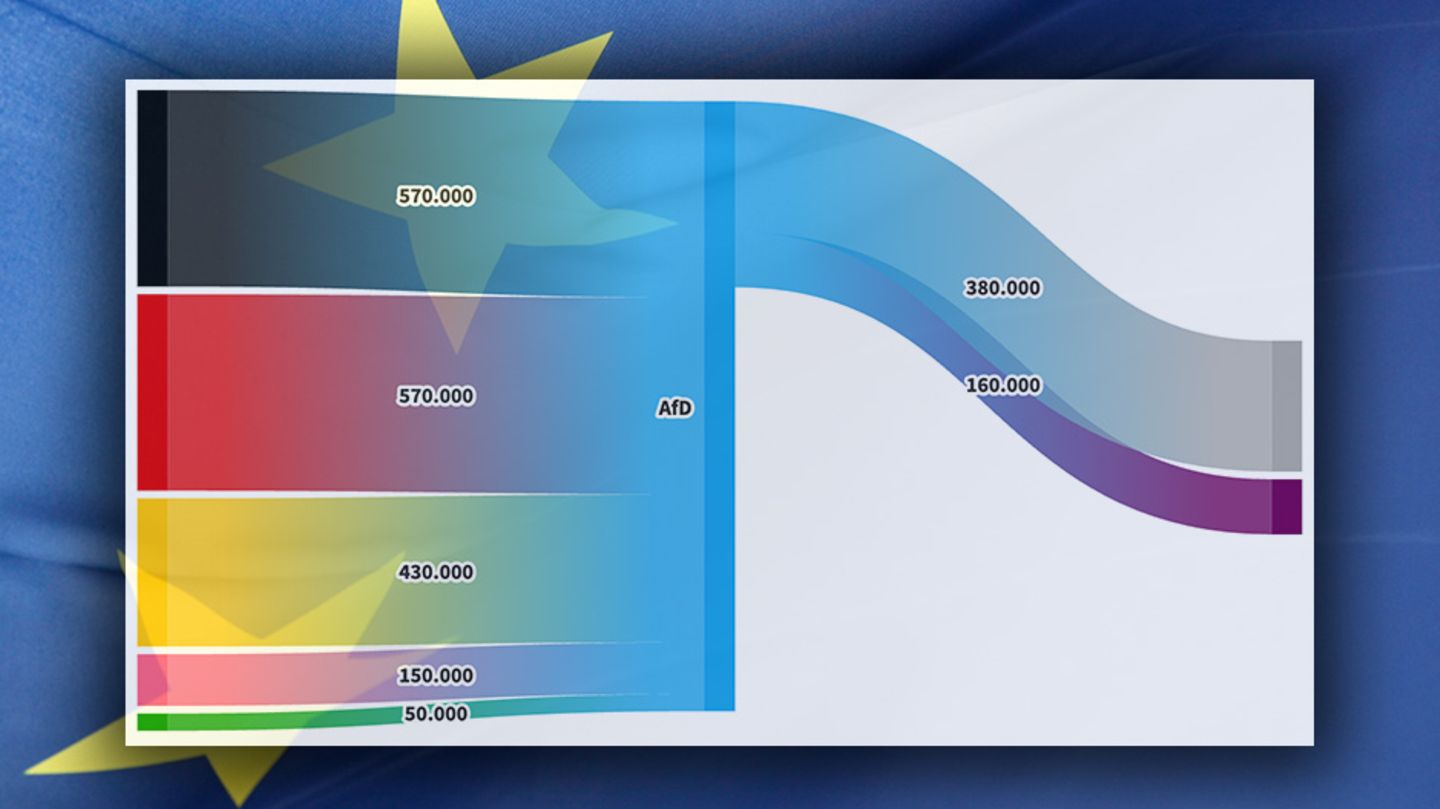
In the European elections, the traffic light parties suffered a lot of defeat. The winners were the Union parties, while AfD and BSW gained ground. Many people preferred not to vote at all. See how the voter flow has been since the last elections.
Heavy losses for the traffic light coalition, a successful start for the BSW, many non-voters – the 2024 European elections brought a lot of movement to the voter flow. You can find quick checks on the individual parties below, more detailed figures on voter migration in the infographic below.
Voter migration to the European elections: quick checks on the parties
The union was able to steal votes from the traffic light parties in particular. The Union suffered losses mainly from the camp of non-voters.
The same thing happened to SPD: In addition to the losses to the Union, AfD and BSW, almost 2.5 million former SPD voters decided not to vote this time.
The green are also in a pretty bad position: They lost votes mainly to the Union, but also to the camp of non-voters. In addition, the BSW in particular took votes away from them.
The third traffic light party FDP suffered a similar fate to the coalition partners: many former voters did not vote this time. The Liberals also lost votes to the Union, AfD and BSW.
The AfD was one of the big winners of the European elections: she was able to steal votes from virtually all parties, but also lost votes to the BSW. Around 380,000 former AfD supporters also became non-voters.
The Sahra Wagenknecht Alliance (BSW) was there for the first time and was able to score points straight away: Voters switched to the BSW, especially from the SPD and the Left. But the newcomer also took votes from all other parties and was also able to motivate non-voters to go to the polls.
Sahra Wagenknecht’s former party, however, lost ground: former left-Voters mainly switched to the BSW, but also to the AfD and the Union. Many did not vote at all and became non-voters.
For more details Click through the graphics below and see how voter flows changed for each party.
Graphic I: Overview of voter trends
About the data used: Voter migration is a rough estimate that compares the migration flows between the last federal election and the European election. The election research institute Infratest Dimap determines the inflow and outflow of voters between the parties for the ARD. The basis is an estimation model that takes into account, among other things, surveys on election night (so-called exit polls), the result of the preliminary count on election Sunday and changes in the electorate itself (such as new first-time voters).
Graphic II: Who young and old voted for
Infratest Dimap also used surveys to determine the share of votes in the various age groups. The AfD also scored well in the younger age groups. However, many votes from voters up to 35 years of age also went to other parties. Of these, the AfD received the most votes. volt Votes from the younger generation: ZDF found that 9 percent of voters under 30 voted for Volt.
Further graphics: Results of the 2024 European elections
The map below shows the parties with the most votes in each state. Below the map you will find detailed results for each federal state.
Above you can see the provisional official final result, further data on the 2024 European elections can be found here
Source: Stern
I have been working in the news industry for over 6 years, first as a reporter and now as an editor. I have covered politics extensively, and my work has appeared in major newspapers and online news outlets around the world. In addition to my writing, I also contribute regularly to 24 Hours World.


