
The economic activity is in a tough recessionary process that affected domestic demand. According to an estimate by the Pablo Barousse Economic and Social Reality Studies Group (GERES), theGDP fell back to 2010 levels, and in per capita terms, to 2006 values. Meanwhile, he stated that in the accumulated period from January to May, the EMAE – monthly GDP advance – showed a fall of 2.9% compared to the same period in 2023. However, if the contribution of the agricultural sector is discounted, which grew 47.1% year-on-year (ia), EMAE excluding agriculture fell 5.9% yoy
“He strong increase in agriculture is due to the recovery of the coarse grain harvest, after the catastrophic drought of 2023 (this sector reaches its highest weighting in GDP in the second quarter). On the contrary, construction (-21.2%), industry (-14.2%) and trade (-10.1%) are the sectors most affected in this hyper-recessionary context. As regards the most recent evolution, the EMAE registered an increase of 2.3% in May. Again, without taking into account the effect of agriculture, which grew 103.3%, EMAE excluding agriculture decreased by 5.4%“the report explained.
What happened to demand in the first quarter
On the demand side, in the first quarter, private consumption fell by 6.7%, public consumption by 5.0% and gross fixed capital formation (investment) by 23.4% year-on-year. “The indicators for consumption and investment available for subsequent months show a continuation of this downward trend. On the other hand, the quantities of goods and services exported rose by 26.1% while those imported fell by 20.1%,” they anticipated.
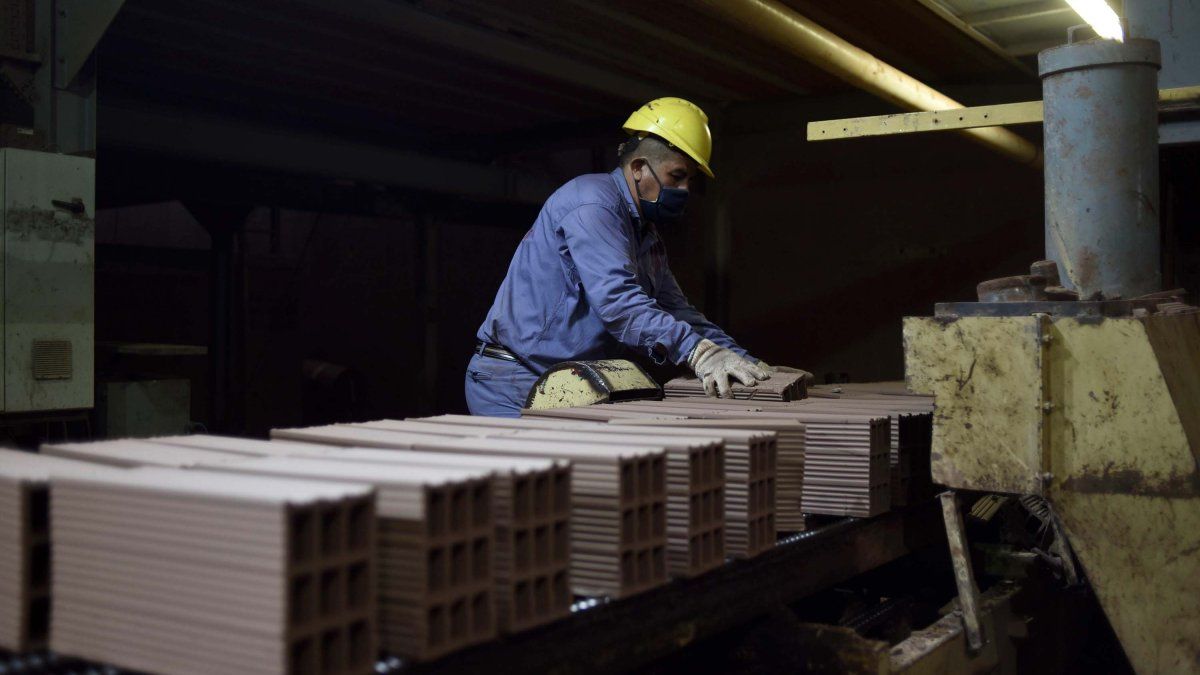
As far as the industry is concernedproduction fell by 14.8% y/y in May and accumulated a decline of 15.2% in the first five months of 2024 compared to the same period in 2023.
Economic activity: which are the sectors with the biggest declines in the first half of the year?
industry1.PNG
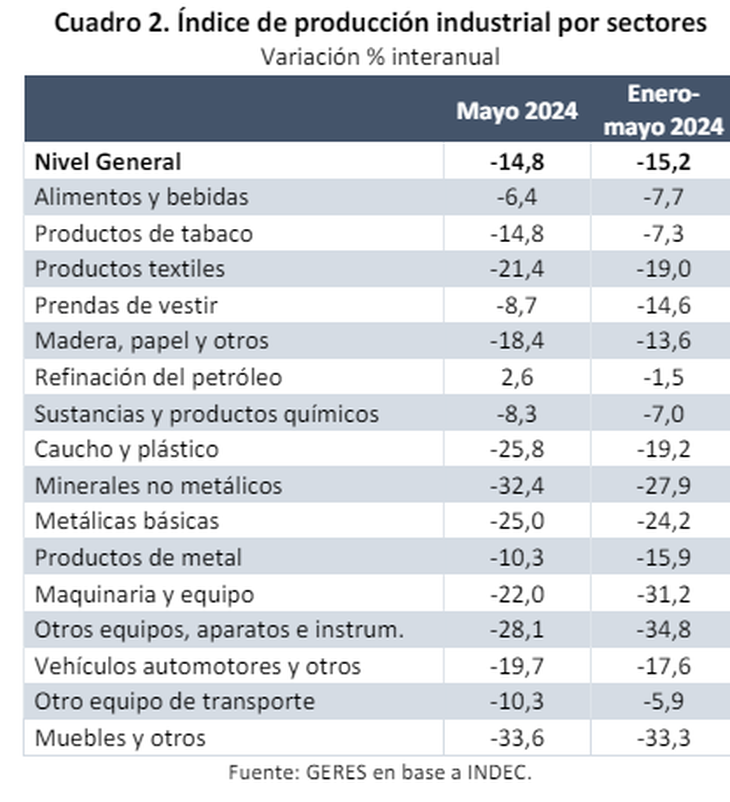
The sectoral opening shows that the decrease in industrial activity in this period is widespread and reaches its greatest intensity in the following branches:: Other equipment, apparatus and instruments (-34.8%), which mainly includes household appliances; Furniture and others (-33.3%); Machinery and equipment (-31.2%); Non-metallic mineral products, closely linked to construction (-27.9%); Basic metals (-24.2%), mainly due to the steel industry (-34.2%), while Aluminium and other non-ferrous metals grew by 0.8%.
The food and beverage sector, much more inelastic because it includes basic necessities, decreased by 7.7%. For its part, the SME industrial production fell by 20.4% in June and accumulated a drop of 19.2% in the year compared to the same period in 2023.
The negative dynamics of industrial activity was also expressed in the use of installed capacity of the industrywhich was 55.8% on average from January to May and 56.8% in the latter month, placing it at its lowest level since 2020 (pandemic and quarantine) and, further back in time, since 2002.
How did construction and mass consumption fare in the first half of the year?
Construction has been by far the hardest hit sector, strongly affected by the paralysis of public worksin addition to the general recessionary context. In the period January-May, the synthetic indicator of construction activity (ISAC) plummeted 32.2% compared to the same months of 2023.
In May, the decline was 32.6% yoy, and beyond the marginal increase of 6.2% monthly (se), it was still 29.4% (se) below the November level. dynamics of cement shipments to the domestic market in June (-32.8% yoy) anticipates that The sector’s debacle persisted that month, although the decline also intensified due to the fewer working days in the year-on-year comparison.
On the other hand, the fall in the purchasing power of salaries, pensions and other income, “had a full impact on the various indicators linked to the massive consume”. In this sense, he explains that in the accumulated to June, the quantities sold in retail stores (CAME) decreased by 17.2% year-on-year. Sales in supermarkets, wholesale self-service stores and shopping centers (INDEC), measured at constant prices, also showed drastic year-on-year declines in the cumulative January-May period. As an additional fact, DGI VAT collection (linked to consumption) decreased by 12.7% year-on-year in June.
Source: Ambito


