

The S&P 500 reached its record level this week. However, less than 1.5% of New York Stock Exchange shares made a new high. How is it explained?
Let’s start with the S&P 500 chart:
The upward trend and strength of the index is undeniable. Every drop has been a great buying opportunity.
He has also set another record: that of concentration.
Just 10 companies represent more than 35% of the index’s weighting, a historical record. Recessions in the US are also marked in the graph with gray bars. This shows that they have coincided with large concentrations in the S&P 500.
One way to see the influence of larger stocks is by comparing the SPY to the RSP:
- SPY: is the S&P 500 ETF, weighted by market cap. That is, Apple and Nvidia have much more weight than the other companies.
- RSP: It is an ETF that follows the same S&P 500 index, but with a different approach (equal weight). Unlike the SPY, the RSP assigns equal weight to each of the 500 stocks in the index, rather than giving greater weight to larger companies.
Below is the comparison of both in 2024:
boggiano3.png
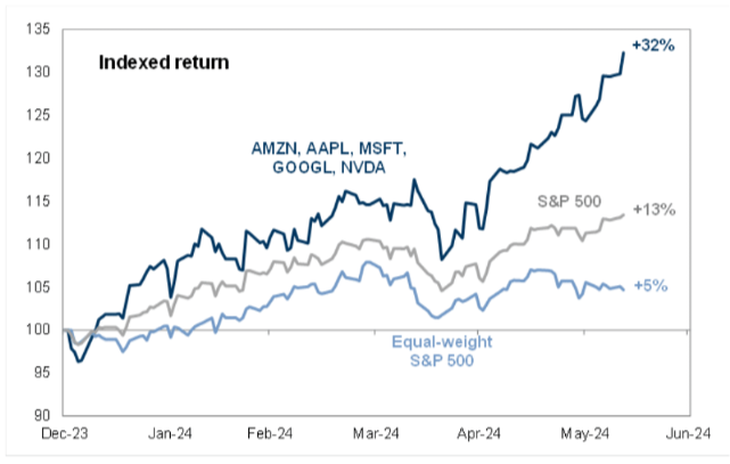
The RSP (S&P 500 equal weight) is only 5% positive for the year. But the famous SPY has more than doubled. Because? For the incredible performance of the main companies. In fact, the first 5 (Amazon, Apple, Microsoft, Google and Nvidia) have risen 32% on average.
Colorful fact: Nvidia accounts for 35% of the 2024 profits of the S&P 500. Amazon, Meta and Microsoft explain a little more than 15%. That is, 496 companies of the 500 that make up the index have had less interference than just 4 companies.
Another example of the great concentration of the market is what happened on Thursday, June 13. That day the S&P 500 reached its all-time high. Do you know how many shares on the New York Stock Exchange (NYSE) made their highest level in the last year that day? 29. That is, on the largest stock market in the world, which includes 2,000 shares, only 29 made a new high for the last year. Less than 1.5%.
And we cannot forget what the Russell is doing, which is the index of US small companies:
boggiano4.png
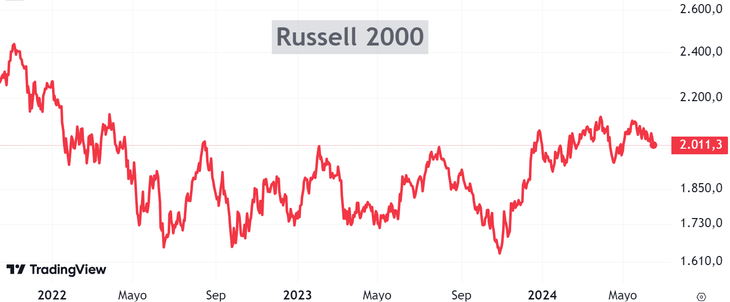
It tells a totally different story than the S&P 500 and has struggled mightily over the past few years. It is the most lagging index and should rise more than 20% to reach an all-time high.
In conclusion, the record concentration of the US market is largely explained by the dominance of large technology companies, especially Nvidia, a leader in the field of Artificial Intelligence.
Furthermore, periods of large concentrations have been ceiling zones, such as before the dot-com crisis. Everything suggests that we are in a similar context. Therefore, long-term investors should take this into account and be very attentive.
Note: The material contained in this note should NOT be interpreted under any circumstances as investment advice or a recommendation to buy or sell a particular asset. This content is for educational purposes only and represents the opinion of the author only. In all cases it is advisable to seek advice from a professional before investing.
Source: Ambito
David William is a talented author who has made a name for himself in the world of writing. He is a professional author who writes on a wide range of topics, from general interest to opinion news. David is currently working as a writer at 24 hours worlds where he brings his unique perspective and in-depth research to his articles, making them both informative and engaging.


