

As they express from Came where they do the survey, the sector thus demonstrates a great recovery power, after having suffered three droughts in a row and early frosts that affected production levels.
During the period analyzed There was a high volatility of international prices, as well as openings of new markets to place the various products and by -products of regional economies.
It is worth mentioning the change of the scenario with respect to the last semester of 2023, in which the export business suffered high exposure to inflation accompanied by political uncertainty, so there was no “business environment”. In the second semester of 2024 the situation changed, the result of the decline in inflation and greater certainty for accommodation of the macro.
With this increase, regional exports reached US $ 8,749 million exported in January 2024 – December 2024, having imported US $ 2,004 million, which shows a commercial surplus of US $ S6.745 million.
Regional economies: complex analysis in dollars
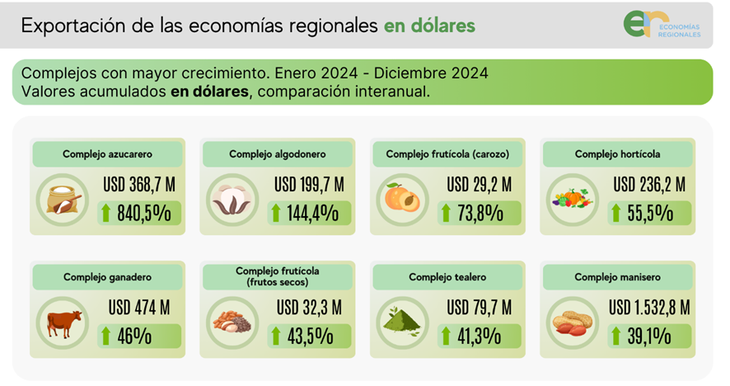
- Sugar complex: During the January 2024 – December 2024, the sugar complex registered a growth of 840.5%, reaching US $ 368.7 million exported. The main export destinations of this complex were the United States (US $206.5 million), Chile (US $ 105.5 million) and Canada (US $21.1 million); That is, these 3 countries concentrated 90.3% of the complex operations.
- Cotton complex: The second growing complex was the cotton, reaching US $ 199.7 million and an increase of 144.4%. The main destinations of this complex were Pakistan (US $ 86.9 million), Vietnam (US $ 46.4 million) and Turkey (US $20.5 million), concentrating 68.3% of operations.
UNNemed (4) .png
Regional economies: Tons complex analysis
- Sugar complex: The complex with the highest growth in volume is the sugarman, having reached 549,893 tons exported and representing 587.4% more than in the previous period compared (January 2023 – December 2023).
The price/ton ratio increased 36.8%, establishing an average price of US $ 670.5.
Unlike what happened in the previous period, the increase in both dollars and tons is due to the good climatic year, which resulted in greater offer, the surpluses should be exported.
- Cotton complex: The second complex with the highest growth in volume is the cotton, which exported a total of 164,862 tons during the January 2024 period 2024, which represents an increase of 115.1% compared to the same period of the previous year. The average price per ton of this complex was US $ 1,211.4, presenting an increase in the export price of 13.6%.
Growth in both dollars and tons is not real in itself, considering that in the previous period compaled a lot of merchandise was retained, exporting practically nothing to the Waiting for a more favorable exchange rateamong other issues.
Regional analysis
In this section a study of the data obtained regionalized. It should be noted that for this the fiscal domicile was taken as a parameter to determine the location of the producer/company/industry that made the export.
Buenos Aires + CABA: It is the main export region of the country, representing 50.9% of the total exported in dollars by regional economies. In the period analyzed, Buenos Aires and CABA had export revenues of US $ 4,461.7 million, which represents an interannual increase of 28.8% in dollars exported.
The most representative complex in its exports was the rancher, having marketed US $ 425.5 million; that is, 9.5% of the total exported by the region.
Center: The region comprised of the provinces of Córdoba, Entre Ríos and Santa Fe, exported US $ 1,782.5 million, 20.4% of the foreign sales of the country. Córdoba, with US $ 870.5 million, was the province that most exported. Compared to the same period of the previous year, the international trade in the region marked an increase of 39.7%, the largest of all regions analyzed.
The complex Manisero It was the most representative, having marketed for a total of US $ 1,086.8 million, which meant 60.9% of the total exported by the region.
Destination analysis
Next, Export destinations of regional economies are analyzed. It is important to clarify that in the data analyzed only the destination ports and, for logistic reasons, an export is carried out towards a certain port, but it is not necessarily the country where the product will be sold or consumed.
This happens for various reasons (port size, draft, merchandise weight, logistics capacity, etc.). As an example, it is observed that in Europe it appears Netherlands as the main destination in the European contine Róterdam port is the largest in the EU.
Europe: First, having been the destination of 32.1% of regional sales abroad, the European continent is located, which was exported for a total of US $ 2,810.6 million. Regarding the previous period, this number represents a 14.8% increase in the dollars exported.
The main commercial partner in this continent was the Netherlands, with a total exported of US $ 675.3 million.
In regional exports to Europe, the sales of the complex predominated Manisero That, having commercialized for US $ 1,122.9 million, it represented 40% of sales to the continent.
UNNemed (6) .png

Source: Ambito
David William is a talented author who has made a name for himself in the world of writing. He is a professional author who writes on a wide range of topics, from general interest to opinion news. David is currently working as a writer at 24 hours worlds where he brings his unique perspective and in-depth research to his articles, making them both informative and engaging.


